

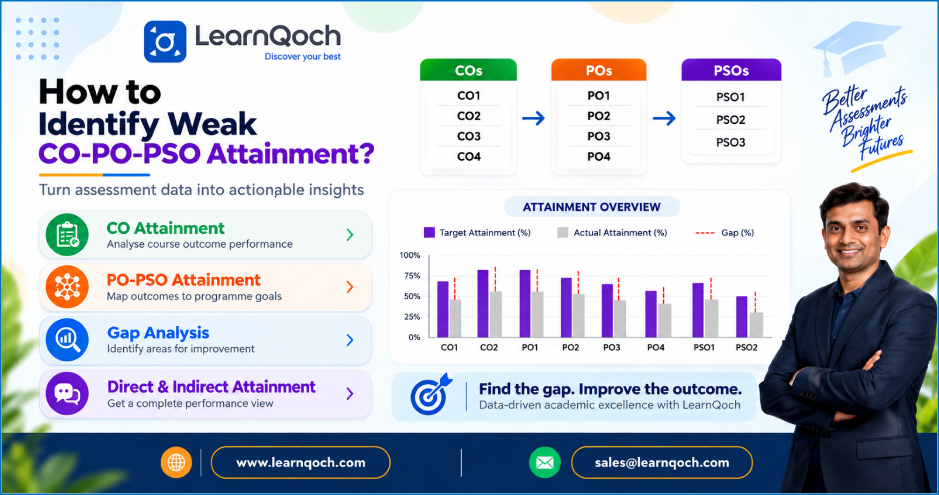
How to identify weak co-po-pso?


Achieving the expected learning outcomes is an important part of Outcome-Based Education (OBE), but knowing where students are falling short is equally important. This is where CO-PO-PSO attainment becomes useful. When attainment levels are consistently below the defined targets, it can indicate gaps in student learning, assessment methods, or course delivery. Therefore, institutions need to look beyond the final attainment score and understand which COs, POs, or PSOs are weak and why?
In this blog, we’ll explore how to identify weak Course Outcomes (COs), Program Outcomes (POs), and Program Specific Outcomes (PSOs) using attainment data and gap analysis. We’ll also look at how faculty can use these insights to plan improvements and strengthen student outcomes. With LearnQoch OBE, institutions can simplify CO-PO-PSO mapping, automate attainment calculations, identify performance gaps, and generate clear reports for continuous improvement and accreditation.
From our previous blog…
If you’re new to OBE or want to understand the basics of COs, POs, and PSOs before exploring attainment, you can refer to our previous blogs. In our earlier blog,what Program Outcomes (POs) in OBE? we explained what POs are, why they matter in Outcome-Based Education, and how they define the knowledge, skills, and competencies students are expected to develop by the end of a program. We also covered how POs support assessment, CO-PO mapping, student development, and accreditation.
When the Principal Asks You to Submit the Gap Analysis Report by Tomorrow?
Principal: “Please prepare the CO-PO-PSO attainment report along with the gap analysis.”
Priyanka Ma’am: “Again? Last time we were asked to prepare CO-PO mapping while preparing the question paper. Now we also need to analyse the gaps. How are we going to manage all this?”
Faculty: “Yes, identifying the weak COs, POs, and PSOs and then finding the reason behind the gap will take a lot of time.”
Priyanka Ma’am: “Rahul Sir, please help us. We need to prepare the report, but I’m not sure where to start.”
Rahul Sir: “Don’t panic, Priyanka Ma’am. Why are you forgetting that we are already using LearnQoch OBE Software?
Priyanka Ma’am: Ohh! my mistake sir.
Rahul Sir: “See, Ma’am, there’s already a Gap Analysis tab in LearnQoch. We just need to learn how to enter the data. Don’t worry, I’ll call the LearnQoch team—they’ll guide us. You can submit the report tomorrow.”
Talk With LearnQoch Experts!What Does “Weak Attainment” Mean in OBE?
In OBE, an outcome is considered weak when its actual attainment falls below the predefined target level. This can happen at the Course Outcome (CO), Program Outcome (PO), or Program Specific Outcome (PSO) level.
For example, if the target for CO3 in a B.Tech Computer Science & Engineering (CSE) program is 70% but the actual attainment is only 52%, CO3 needs attention. If PO2 also shows consistently low attainment across multiple CSE courses, it may indicate a broader program-level gap requiring focused improvement.
However, one low score does not always mean that an outcome is permanently weak. Faculty should look at attainment trends across courses, assessments, semesters, and academic years before deciding where improvement is required. LearnQoch’s OBE approach supports this analysis by bringing mapping, assessment data, attainment, and gap analysis into a connected workflow.
How to Identify Weak COs?
The first step is to analyse CO-wise attainment for each course. Faculty can compare the actual attainment of every CO against the defined target.
For instance:
| Course Outcome | Target | Actual Attainment | Status |
| CO1 | 70% | 76% | Achieved |
| CO2 | 70% | 72% | Achieved |
| CO3 | 70% | 51% | Needs Improvement |
| CO4 | 70% | 68% | Needs Attention |
Here, CO3 clearly requires further analysis. Faculty can then review the assessments linked to CO3 and check whether students struggled with a particular topic, question type, practical activity, or learning method.
This makes CO attainment more useful than simply looking at overall subject marks. It helps faculty understand which specific learning outcome needs attention.
How to Identify Weak POs?
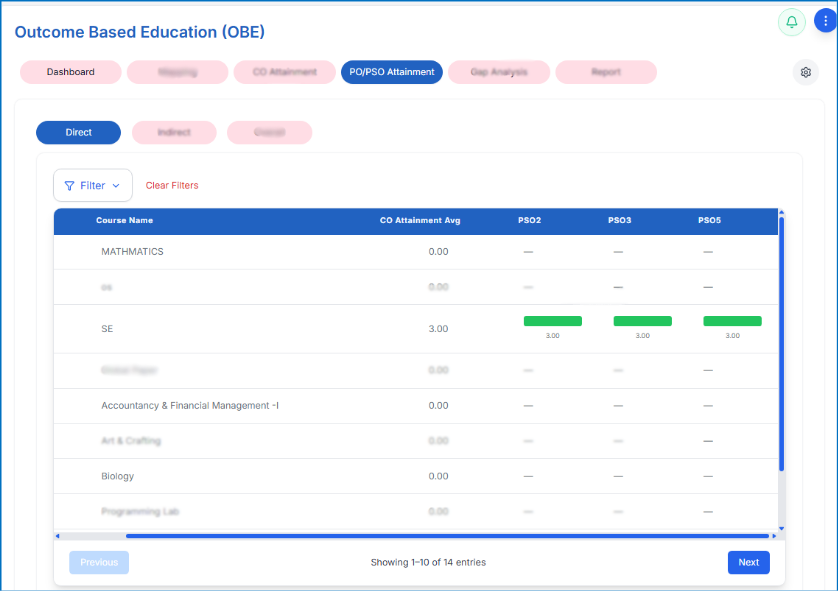
POs are linked to multiple courses, so a weak PO should be identified by looking at its attainment across the program.
For example, suppose a Diploma in Architecture program has 11 POs and PO3 – Design/Development of Solutions has a target of 70%. If PO3 attainment remains below the target across courses such as Architectural Design, CAD, Building Construction, and Working Drawing, it may indicate a broader program-level gap.
| Program Outcome | Target | Actual Attainment | Status |
| PO3 – Design/Development of Solutions | 70% | 58% | Needs Improvement |
| PO5 – Modern Tool Usage | 70% | 74% | Achieved |
Faculty can then review the mapped COs and assessments to understand where students are struggling. LearnQoch OBE helps connect this data, making it easier to identify weak POs and plan improvement actions.
How to Identify Weak PSOs?
Program Specific Outcomes (PSOs) describe the specialized technical or professional skills students are expected to develop within a particular program. The number of PSOs is defined by the institution or program based on its academic requirements.
For example, a Diploma in Architecture program may define two PSOs:
| PSO | Target | Actual Attainment | Status |
| PSO1 – Architectural Design & Drafting Skills | 70% | 74% | Achieved |
| PSO2 – Building Construction & CAD Skills | 70% | 58% | Needs Improvement |
PSOs are mapped with relevant COs and assessments. If PSO2 remains below the target, faculty can review the contributing courses and practical assessments to identify where students need more support.
This helps institutions assess whether students are developing the program-specific skills they are expected to gain.
Use Gap Analysis to Find the Real Problem
Identifying a weak outcome is only the beginning. The next question is: Why is the attainment low?
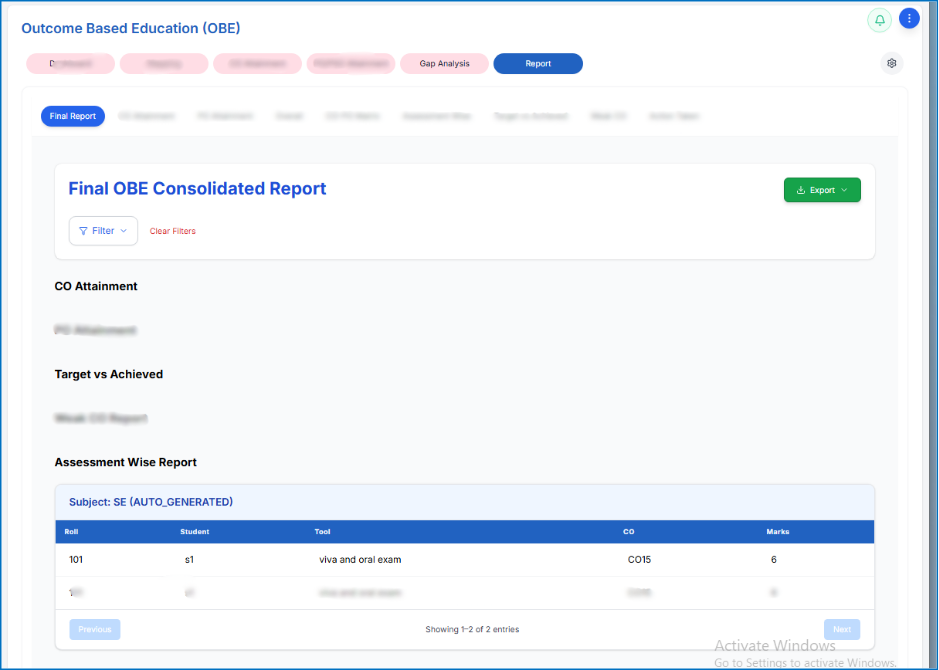
For example, if a CO3 target is 70% but its attainment is 52%, there is an 18 percentage-point gap. Faculty can then review the assessments and courses linked to CO3 to understand what may be causing the low performance.
Faculty can analyse factors such as:
- Low student performance in specific assessments
- Insufficient practical or application-based learning
- Misalignment between COs and assessments
- Weak CO-PO-PSO mapping
- Difficulty level of questions
- Teaching or learning gaps
- Limited opportunities for practice and application
This turns attainment data into an actionable improvement plan rather than simply another report. LearnQoch’s OBE framework supports gap analysis so institutions can identify weak outcomes and plan corrective actions for continuous improvement.
How LearnQoch Helps Identify the Gap?
With LearnQoch OBE, the analysis can be followed through a connected workflow. Assessment results are linked with the relevant COs, POs, and PSOs, and attainment is calculated using the institution’s defined OBE methodology.
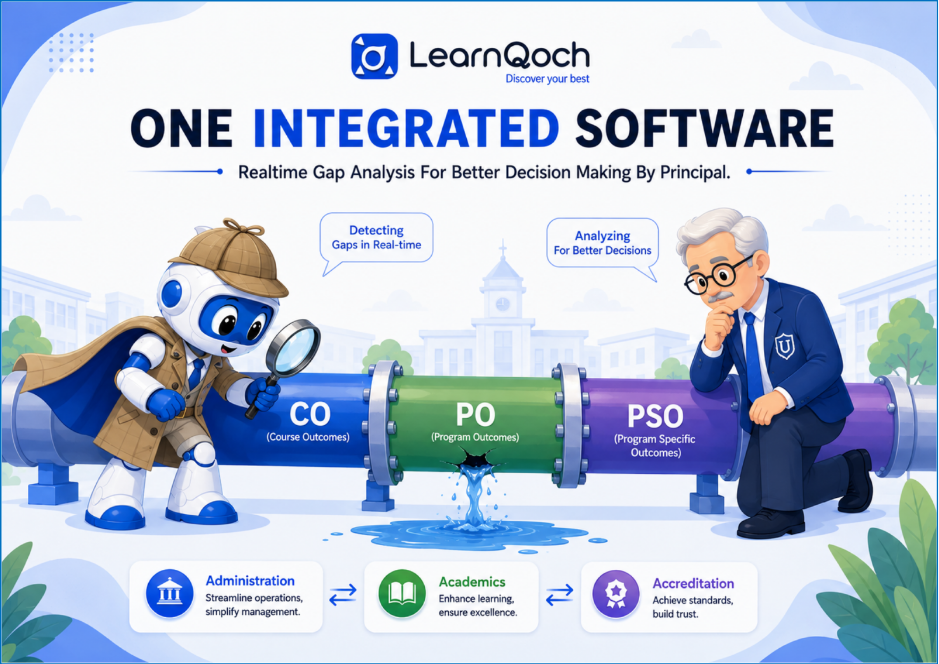
When attainment is below the defined target, the gap can be identified in reports and dashboards. Faculty can then trace the outcome back to the courses, COs, and assessments contributing to it. This helps them understand whether the issue is limited to one assessment or reflects a recurring gap across courses or semesters.
For example:
Target: 70% → Attainment: 52% → Gap: 18 points → Identify contributing COs/courses → Review assessments → Plan corrective action
This helps institutions move beyond simply reporting low attainment and use the data to identify where improvement is needed and take informed corrective action.
The LearnQoch AI Powered Integrated Solution
A unified platform that connects administration, academics, student services, finance, examinations, placements, and accreditation on a single digital ecosystem, helping institutions manage their complete academic journey efficiently.

Facilitates modern teaching and learning while tracking student progress, assignments, assessments, and course outcomes.
A unified system that digitizes the entire exam cycle—right from planning, subject allocation, ATKT processing, and scheduling to question paper creation, assessments, evaluation, and result generation. It ensures transparency, accuracy, and smooth coordination across all departments.
Streamlines administrative activities, simplifies student data management, and ensures workflow automation across all departments.
- LearnQoch AI powered Task Management
Manage professional and personal tasks, assign responsibilities, set priorities, and track progress from a single platform—eliminating the need for multiple spreadsheets and giving teams a clear view of all ongoing tasks
- AI powered Placement Module
Manages placements from job postings to offer letters while maintaining student placement data that can be used for performance analysis, accreditation reporting, and evidence of student career outcomes.
Simplifies accreditation with ready-to-use templates, QLM/QNM data matrices, DVV support, and accreditation-ready reports, reducing manual effort and keeping institutions audit-ready.
- AI powered Digital Presence & Branding
LearnQoch AI-powered Growth+ – Manage social media, campaigns, and website activities from one platform, with performance reports in sheets, PDFs, and graphical dashboards for better insights.
Experience LearnQoch Before You Decide
See how LearnQoch’s AI-powered digital platform can simplify academic and campus management with a 14-Days Free Trial.
Book Your Free Demo Now!Our team will help implement the platform for your institution, giving you the opportunity to explore its features, understand its capabilities, and experience the difference firsthand.
👉 Ready to transform the way your institution manages academics and campus operations?
📞 Contact us at +91 84519 01079
📧 Email: sales@learnqoch.com
Explore What we Offers:
Visit www.learnqoch.com for Full Details
FAQs
1. How can institutions identify weak CO-PO-PSO attainment?
Weak attainment can be identified by comparing actual CO, PO, and PSO attainment with the institution’s defined target levels. Low attainment indicates areas where students may need additional academic support. LearnQoch OBE helps institutions track attainment data, identify gaps, and analyse outcomes more systematically.
2. What are the signs of weak CO, PO, or PSO attainment?
Common signs include consistently low attainment levels, poor performance in outcome-linked assessments, and gaps between expected and actual learning outcomes. With LearnQoch, institutions can analyse assessment and attainment data to highlight outcomes that need attention and support continuous improvement.
3. How does CO-PO-PSO attainment help identify learning gaps?
CO-PO-PSO attainment connects assessment performance with defined learning outcomes, helping faculty understand where students are performing below expectations. LearnQoch OBE brings mapping, assessment data, attainment analysis, and gap identification together, making it easier to take data-driven academic decisions.
4. How can faculty improve weak CO-PO-PSO attainment?
Faculty can review the courses, assessments, and learning activities contributing to low attainment and make targeted improvements. LearnQoch provides structured attainment data and insights that can guide faculty in reviewing teaching strategies, assessments, and areas requiring additional student support.